Visualization
Overview
The current Opal Kelly and Intan recording hardware allow for a few or a few thousand channels of electrophysiological signal to be recorded from simultaneously. The user must be able to quickly assess the quality of the incoming signals and the performance of the automatic spike sorting routines. The main visualization displays of Intan.jl allows the user to view a signal channel at a time and multiple channels at once.
Interface
Single Channel Display
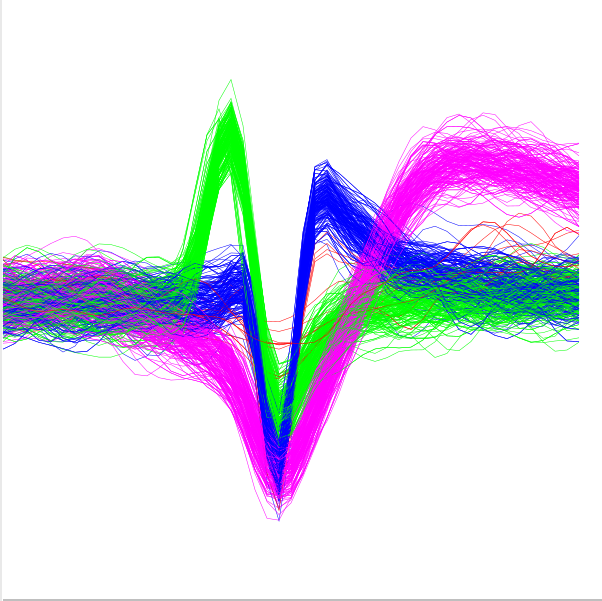
The left display shows voltage-time plots of detected spike events. The scroll bar at the bottom can be used to select the individual channel from the group display (to the right) to display.
Different clusters are represented with different colors.
Multi-channel Display
The right display shows voltage-time plots of 16 channels simultaneously. The scroll bar at the bottom can be used to select which group of sixteen channels to display. This will reset the left display to the first channel in this group.
Different clusters are represented with different colors.
Waveform Display
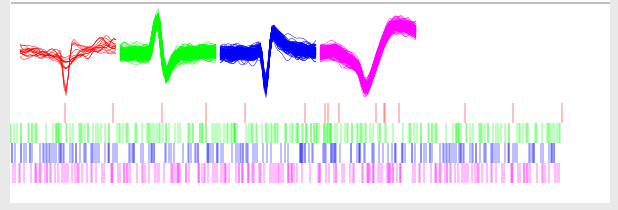
For better visualization, each waveform on the main display channel will be plotted separately, along with the corresponding spike raster.
Event and Analog Display
Up to six channels of analog and ttl signals can be displayed at one time. The signal of interest can be selected from the combo boxes to the right. By default, no channels are selected. TTL channels will display as either high or low, while analog signals will show continuous changes.
Control
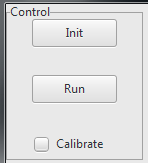
Before starting, click the Init button to connect to the FPGA and calibrate the headstages. The run button will start collecting data. The first data is initially collected in “calibration mode.” All the board to run for several seconds (or longer depending on what spike sorting method is selected) before unchecking the calibration box. After this box is unchacked, data will begin to be displayed on the displays.
Channel Gain
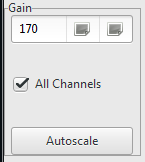
Gain can be adjusted for a single channel or, with the All Channels checkbox selected, for every channel on the headstage. The autoscale button will try to calculate the optimal gain value for the channel which is displayed.
Channel Threshold
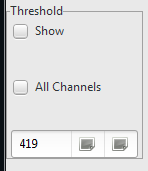
The threshold can be adjusted for a single channel, or with the All Channels checkbox selected, for every channel on the headstage. The show checkbox is used to display the threshold for the single maximized channel.