Getting Started
Overview
This brief guide describes how to start the GUI, begin collecting extracellular electrophysiological data, and use some of the online spike sorting tools. Additional more comprehensive documentation can be found in later sections.
Connecting Intan
Creating GUI
Start the Julia terminal.Then load the Intan package:
using Intan
The GUI can be started with the following line of code:
Intan_GUI()
This will create a GUI with the default configuration file. The configuration file specifies how many evaluation boards and headstages are connected, what behavioral task is to be run, how data is to be saved, etc. The default assumes that a 64 channel RHD2164 headstage is connected to the Port A1 of the Intan Evaluation board.
These files are simple and typically only a few lines of code. The user can create their own and then load it passing the path to the file as an argument to Intan_GUI:
Intan_GUI("/path/to/your/configuration/file.jl")
More documentation on designing the appropriate configuration can be found in its own section of this guide.
Interface Overview
Now the interface should appear. The GUI is divided into several regions by default:
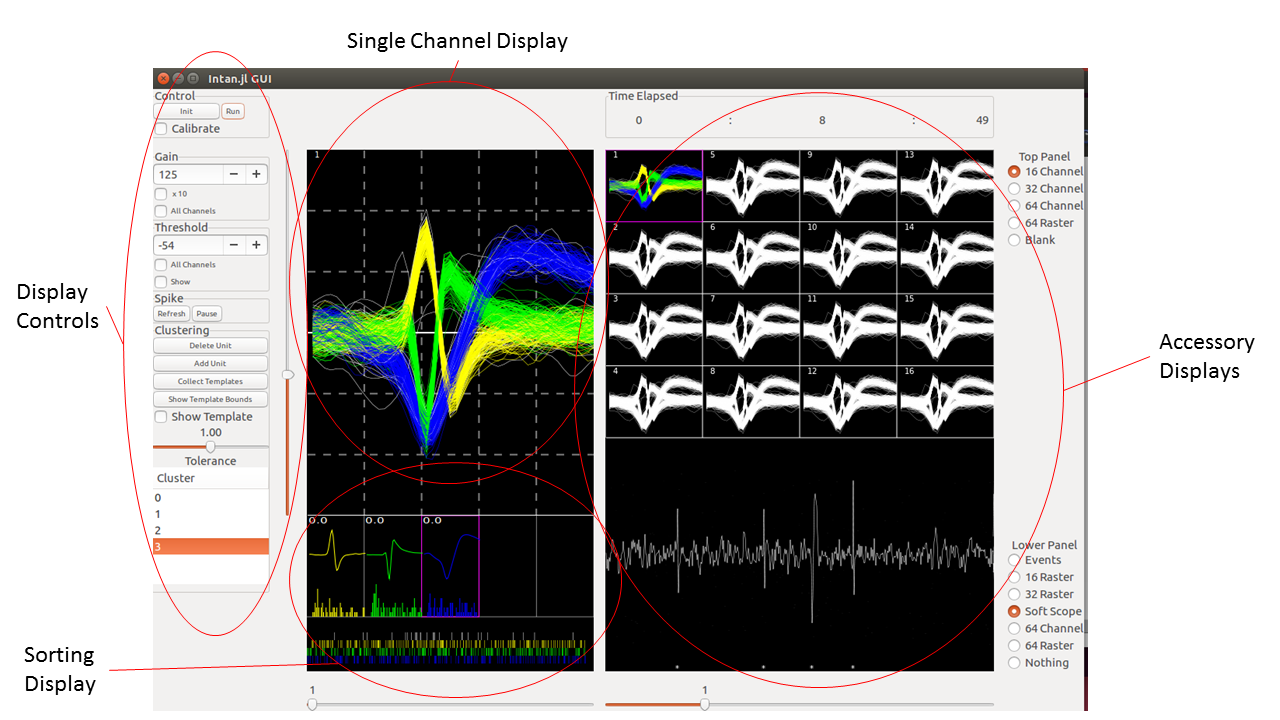
The far left pane contains the most commonly used buttons for online spike sorting and data visualization. This pane also contains the buttons that start the data acquisition at the top.
The upper left pane shows a magnified view of a single channel. By default this shows the snippet of voltage surrounding a threshold crossing. The slider to set that threshold crossing is located on the left hand side. In this view, waveforms assigned to particular clusters (single units) will be assigned different colors.
The lower left pane shows spike sorting specific visualizations from the single channel highlighted above. These include the templates used for online template matching, and the color coded spike rasters for each individual unit.
The right pane is used for additional visualizations of incoming data. Some of these include 1) multiple channel displays, 2) multiple channel spike rasters, 3) digital oscilloscope and 4) digital events and analog signals from data given to the TTL and ADC inputs to the Intan evaluation board. One the right side of this pane are the buttons used to select which of these are displayed.
Finally, the top menubar has additional options, such as saving and loading sorting parameters, changing sorting options, and defining reference configurations.
Data Acquisition
The buttons used to start acquisition are located in the top right of the GUI. To begin data acquisition, first communication with the evaluation board and headstages must be established. This is done by clicking on the “Init” button. The output of the Julia terminal should indicate if the board is found and initialized correctly.
The “Run” button will begin acquisition with the evaluation board. After clicking the run button, the experimental timer should start climbing on the top right of the GUI. You will see that the “Calibrate button” is checked at this point, and data is not being displayed. At first, the data is being used by the software to start to find optimum threshold and sorting values. This calibration period only needs to last a second or so. To start data visualization, uncheck the “calibrate” box.
Data Visualization
Now waveforms should start to appear in the single channel and multi channel displays. Only waveforms (snippets of the raw voltage signal from a channel) crossing a threshold value are displayed. The user can right-click in this window at any time to refresh the display.
Threshold and Gain
The user can manipulate this signal in two important ways: 1) changing the threshold value necessary for a waveform to be display, and 2) changing the gain of the incoming voltage signal. The current threshold and gain values are displayed to the left of the single channel display. The user can change the gain value (make the signal larger or smaller) by changing the value in the box to the left of the display. The threshold can be adjusted by dragging the threshold slider, located immediately to the left of the display.
The gain can be adjusted in multiples of 10 by selecting the x10 box. Additionally, the gain for every channel, not just the one displayed, can be modified by first selecting the “all channels” box under gain (remember to turn this off when you are done using it!)
The threshold can be displayed as a line across the single channel display by checking the “show” box in the threshold pain. Additionally, the threshold for all channels can be adjusted by selecting the “all channels” box under threshold (remember to turn this off when you are done using it!)
Selecting different channels
You can change the channel that is displayed in the single channel display by 1) left-clicking on the channel in the multi-channel display or 2) dragging the slider under the left pane to the desired channel value. Either way, the single channel that is displayed should change, as indicated by the number displayed in the top left of the single channel display, and by the purple box drawn around the selected channel in the mutli-channel display. Note that the slider under the left pane only allows you to select channels visble on the multi-channel display to the left. For instance, if there are 32 channels total, but you are only using the 16-channel display, you can only select channels 1-16. To see the second 16 channels (17-32), you can move the slider located under the multichannel display to change which channels are visualized.
Other displays
The buttons on the right side of the right display allow the user to change which additional visualizations are available. Depending on their size, multiple can be shown at once.
16, 32, and 64 channel displays
Waveforms from 16, 32, or 64 channels can be displayed simultaneously. These work the same as the 16 channel display in that the selected single channel is highlighted in purple, and you can select a single channel by clicking on it. If a channel is not needed to be visualized, the user can right-click on that channel and selected “disable”.
16, 32, and 64 channel rasters
Raster plots are temporal event plots, where each event (a waveform detected on that channel) is displayed as a vertical bar at approximately the time relative to when the screen refreshed. Each raster displays about ~10 seconds worth spikes. Each spike will be color coded based on the unit it is assigned to during spike sorting.
Soft Scope
This is a digital oscilloscope that shows the raw voltage trace for the channel that is displayed in the single channel window. By right-clicking, the user can change the voltage-gain, time divisions, and whether or not the threshold will also be displayed. Asterisks are shown at the bottom of the soft scope to indicate signals that were identified as threshold crossings.
Events
This display can be used to visualize data that is received on either the analog-to-digital convertor on the Intan evaluation board, or as a TTL event on the evaluation board. Up to 6 different channels can be displayed at once. To display an event, right click on the section of the plot wher eyou would like that signal to be displayed and select the channel from the dialogue box.
Spike Sorting
The general technique used by Intan.jl for spike sorting is 1) selecting waveforms thought to belong to an individual neuron 2) building a template from these waveforms, and 3) performing template matching with this template, and 4) if it is a match, assigning that waveform as belonging to that individual neuron. The user can create as many separate templates as necessary for a single channel.
The “cluster” dialogue box at the bottom left indicates which cluster, or unit, is currently selected. By default, a channel will only have the 0 cluster, which indicates that there are no units and consequently no template matching that will be performed. As you add units, this list will be populated with more units (1, 2, 3 etc). You can click on each unit to make it the “active unit.”
Selecting Waveforms
At any time, you can left-click in the single channel display, hold, and drag. You will see a rubberband created while doing this. Any units that cross this rubber band when you let go of the left-click will be assigned to the currently active cluster, and a template will be generated from those waveforms. Right now, selecting units with the 0 cluster selected should do nothing.
Collecting Templates
By default, the single display will be continuously updated as new waveforms stream in, and will automatically refresh about every 10 seconds. This can make unit selection difficult; therefore, you can select the “Collect Templates” button to refresh the display followed by more waveforms continuing to be plotted in real time. The “collect templates” button will now read “stop collection”. Once “stop collection” is selected, the single display will freeze. While data will continue to stream in, the user can manipulate these units on the display.
In the “collect units” mode, the right-click now will also generate a rubberband if the user clicks, holds and drags. Any units that cross this rubber band when it is released will be “masked” and disappear from the display. This can be used to clear obvious noise from the display before moving onto template generation. This mask feature works when the “0” cluster is selected.
Adding Units
Selecting Waveforms
To create a new unit, first click the “add unit” button. In the cluster list, you should see a new unit appear with the number 1, and it will be automatically selected. Now any units that are selected with the left click rubber band will be assigned to that unit. Left-click, drag and release to select a group of units, and you will see the waveforms turn the same color as the new cluster (yellow for cluster 1). Of note, the user should also see each unit turn that color in real time, so that the user has real time feedback about which units will be selected.
Deselecting Waveforms
The user can also use the right-click rubberband to remove units from the display. If unit 0 is selected, these units will be removed from the display. However, if the current unit is selected waveforms not belonging to that unit will be removed from the display, but waveforms that were assigned to that unit will be removed from the display and the template will be recalculated with those units subtracted. In this way, the user can always be generous in their first selection and “prune” away unwanted waveforms to create the best template.